
Purpose
The Response Monitor is used to display the response time of CET from a user’s actions. This tool helps to track the time taken to perform certain tasks/actions and measure the timespan between a user’s action and the system response. The tool is useful to gauge the performance between different CET versions.
Settings
The Settings button determines the user actions that are to be recorded in the Response Monitor dialog. The Response Monitor Settings window consists of common user actions in CET which includes for example blocks, group and freezes, save and load, undo and redo.
The 'User Defined Traces' are special user actions added by a developer that they would like to have trace in the Response Monitor dialog. An example of user defined traces are by adding levels into the drawing to track the switch between active levels and time taken to toggle level visibility.
The 'Check all' button enables all Categories and User Defined Traces, wheareas 'Uncheck all' disables all Categories and User Defined Traces.
Users are also able to further control the visibility of specific User Defined Traces within a Category using the options under User Defined Traces.
It will show like: (Category) Specific User Defined Trace
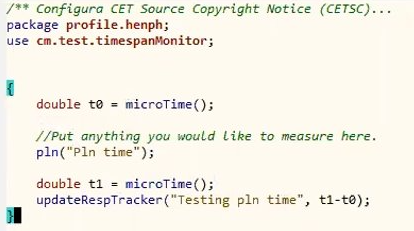
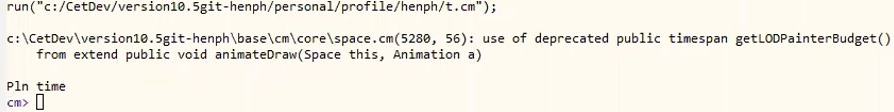
Customized Trace
You can have a Developer add in the customized traces into the Response Monitor dialog for testing new features or functions.
Using Response Monitor without QA Scripts
- Click on 'Response Monitor …'
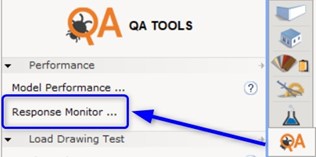
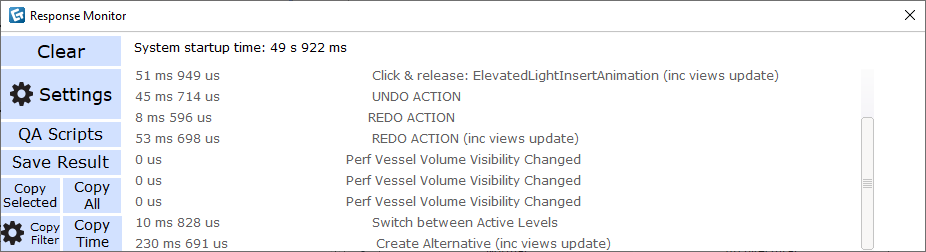
- The Response Monitor dialog will appear.
This dialog has to remain open in order to track the response time.
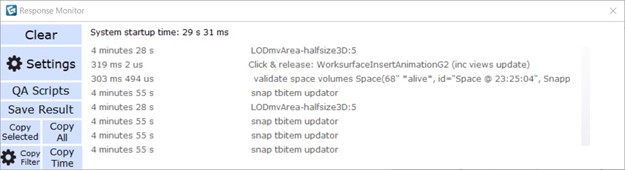
- Perform a user action such as inserting a symbol into the drawing, replicate, copy and paste, create alternative. The time taken to perform the action as well as the time taken for the view to update would be recorded into the Response Monitor.
 Uncheck 'Priority Tasks' in the Settings dialog to remove the 'snap tbitem updator' traces.
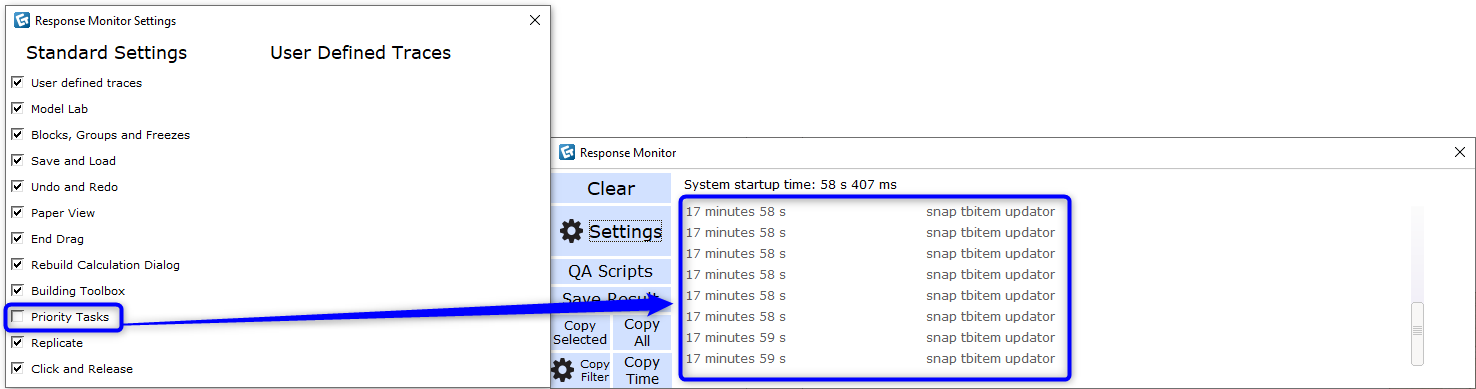
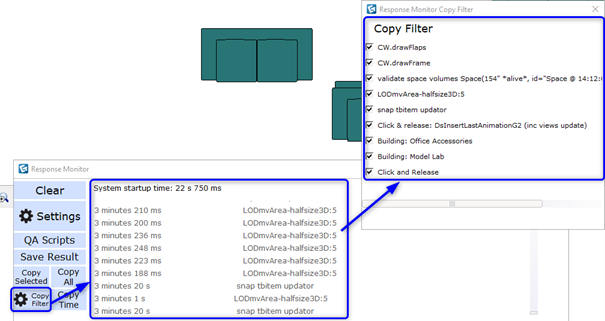
- In the Response Monitor you can perform several actions using the available buttons.
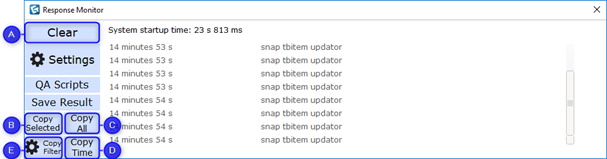
A. Clear - Clear all results in the dialog
B. Copy Selected - Copy the selected row of results
C. Copy All - Copy all results in the dialog
D. Copy Time - Copy only the time of the results. The time of all rows will be copied if there are no rows in selection
E. Copy Filter - Filter the results currently in the dialog that you would like to be copied. Note that the results displayed in the dialog would not be updated to reflect the filter
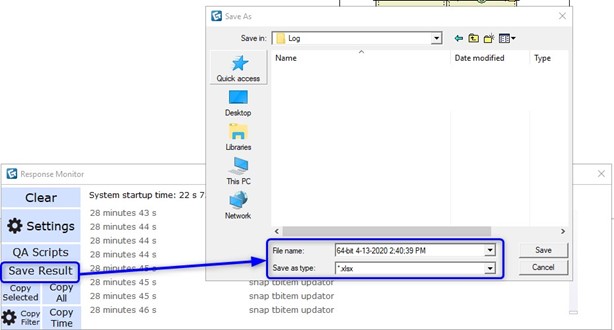
- You can then save the results to an Excel file by clicking on the 'Save Result' button. You can specify the save location of the results or have it remain in the default location C:\Users\[user]\Documents\CET Documents\Response Monitor\Log.
The suggested file name is created based on [‘CET version’ ‘Date Created’ ‘Time Created’].
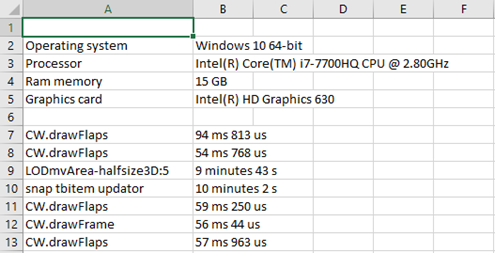
The excel file will consist of the results in the Response Monitor dialog along with additional information such as the operating system, processor, RAM memory and graphics card used by the user when the test was performed.
QA Scripts
The QA Scripts can be found in the Response Monitor dialog. The purpose of this tool is to create a standard set of tests in the form of reusable scripts (.xml) that can be run automatically for Performance testing.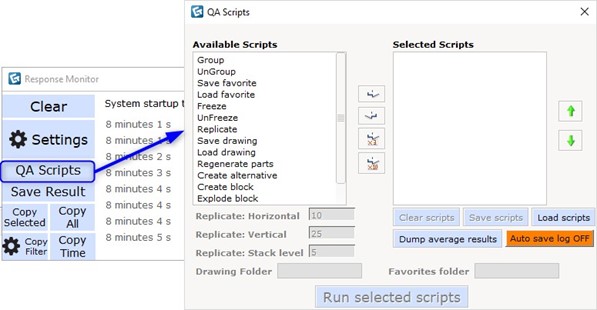
Using Response Monitor with QA Scripts
- Click on 'Response Monitor …' and click on the 'QA Script' button in the dialog.
The Response Monitor dialog has to remain open in order to track the response time.
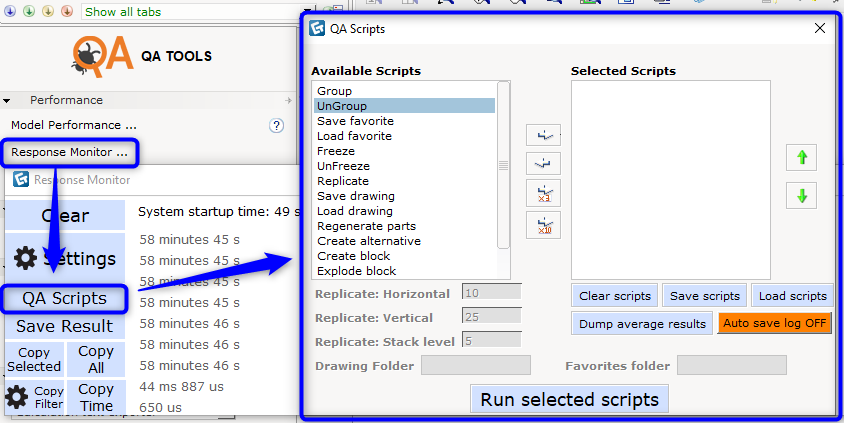
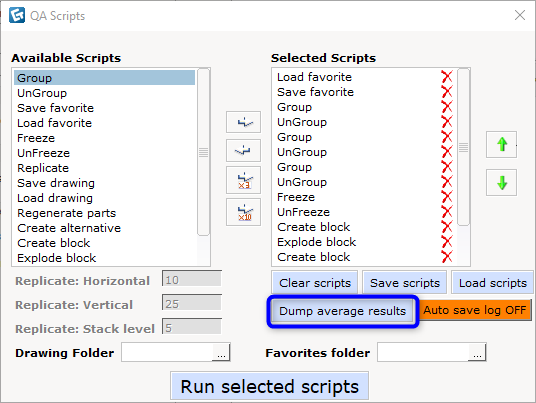
- In the QA Scripts dialog, there are list of 'Available Scripts' and 'Selected Scripts'. The Available Scripts are a list of possible user actions while the Selected Scripts are the list of actions that you would like to be included in the test run. From the dialog, there are several ways to edit the Selected Scripts.
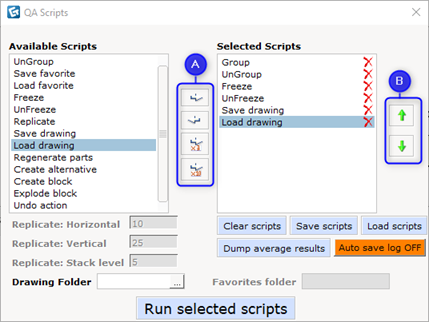
A. Arrow buttons - Used to move scripts between Available Scripts and Selected Scripts. The arrow buttons also consist of
 and
and  which are used to add scripts to the Selected Scripts in bulk.You can remove a script by selecting the
 button beside each Selected Scripts.
B. Order button - Used to sort the order on which action to perform first. The order starts from top to bottom in the Selected Scripts
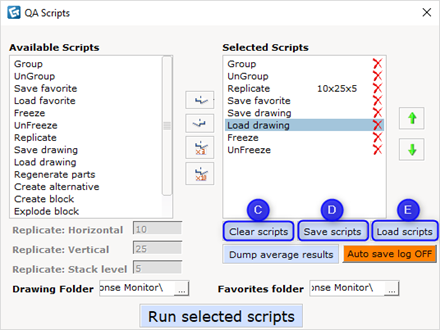
C. Clear Scripts - Clear all scripts that are in the ‘Selected Scripts’ section
D. Save Scripts - Save all scripts that are in the ‘Selected Scripts’ section in its exact sequence as a .xml file.
The suggested file name is created based on [‘Date Created’ ‘Time Created’].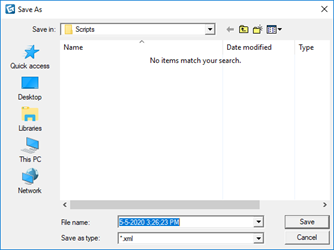
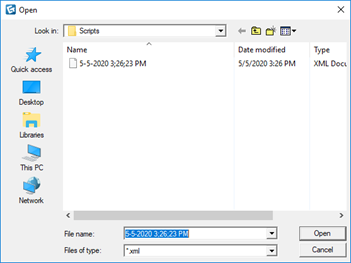
E. Load scripts - Load the previously saved scripts from the .xml file
The replicate, load/save drawing and load/save favorite action can be customized if they are selected into the ‘Selected Scripts’ section.
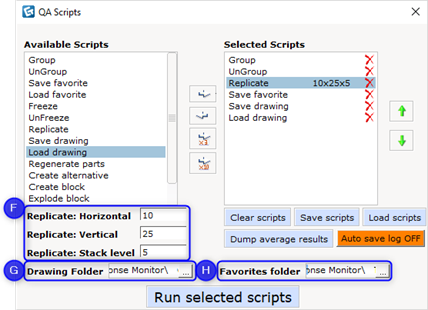
F. Replication Settings - The number of replication for horizontal (x) , vertical (y) and stack level (z) that is to be performed on all symbols in the drawing
G. Drawing folder - The location to save/load drawing when the Save drawing and Load drawing scripts are performed
H. Favorites folder - The location to save/load favorites when the Save favorite and Load favorite scripts are performed
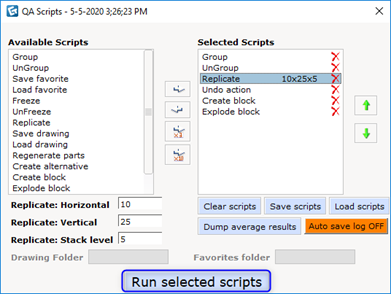
- Select ‘Run selected scripts’ to automatically perform the actions in the 'Selected Scripts' section.
After selecting ‘Run selected scripts’, the tool will go through several checks to ensure that the sequence of the scripts are safe/logical. For example consecutive Replicate scripts will cause the drawing to be exceedingly large as all symbols in the drawing will be replicated after each Replicate action is completed. Similarly a Unblock action cannot be done before a Block action as the drawing does not consist of any Blocks.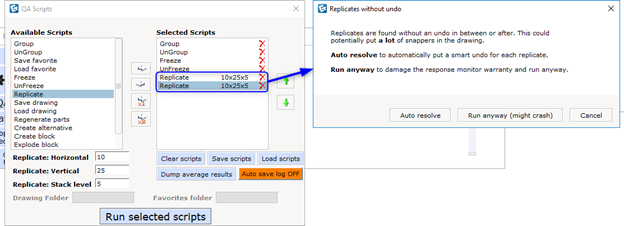
If the tool detects an issue with the sequence, a dialog will appear for you to choose the following action.
- Auto Resolve - The tool will attempt to add a script before/after a selected script to ensure that the sequence of actions are valid and to also avoid crashes
- Run Anyway (might crash) - Proceed to run the scripts in the Selected Scripts with the chosen order
- Cancel - The operation is aborted, no scripts are run
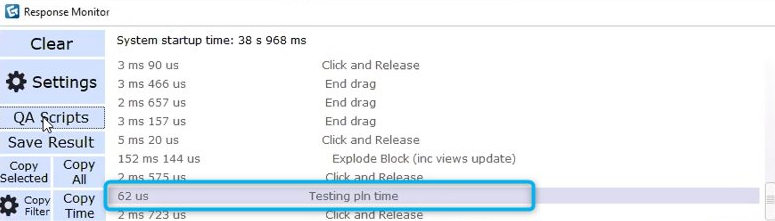
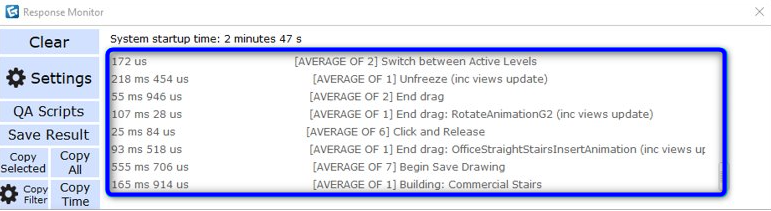
- The time taken for each action to be performed will be listed out in the Response Monitor dialog.
You can click on the 'Dump average results' button in the QA Scripts dialog to get the average time take for a specific action.
- You can then save the results to an Excel file by clicking on the 'Save Result' button. You can specify the save location of the results or have it remain in the default location C:\Users\[user]\Documents\CET Documents\Response Monitor\Log.
The suggested file name is created based on [‘CET version’ ‘Date Created’ ‘Time Created’].
The excel file will consist of the results in the Response Monitor dialog along with additional information such as the operating system, processor, RAM memory and graphics card used by the user when the test was performed.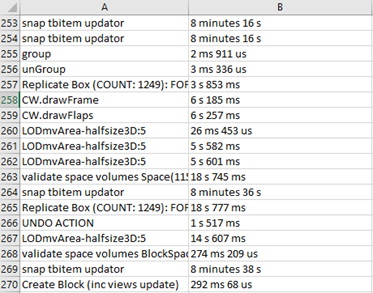 In the QA Scripts dialog, there is an option to 'Auto save log' after the selected scripts are run and the results will get automatically saved in C:\Users\[user]\Documents\CET Documents\Response Monitor\Log\Autosave
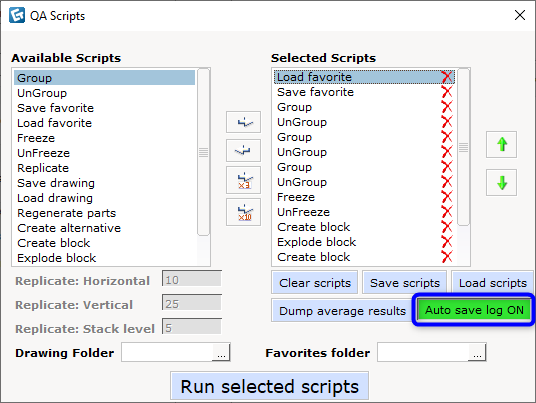
Tips for Testing
- To compare between version, it is advisable to use the same Favorite file or Drawing file between each versions.
- For a more accurate result, repeat the action several times and get the average time taken.
- QA Script's results can differ from real usage especially when Selected Scripts consist of many scripts. This is due to CET not having the time to relax between each action/script
Comments
0 comments
Please sign in to leave a comment.